Free Courses Sale ends Soon, Get It Now


Free Courses Sale ends Soon, Get It Now



Disclaimer: Copyright infringement not intended.
Context
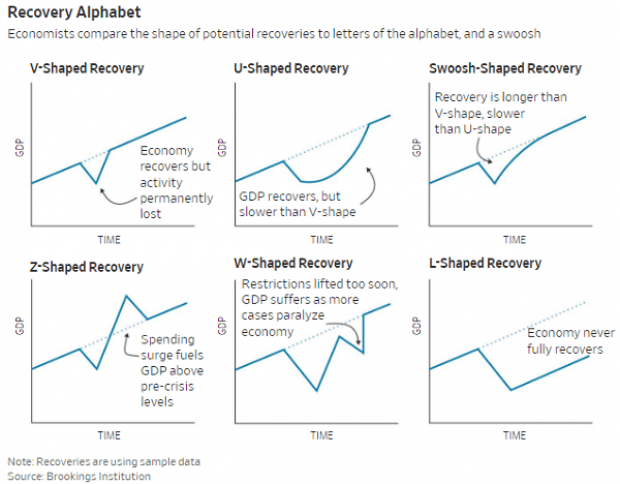
SHAPES OF ECONOMIC RECOVERY
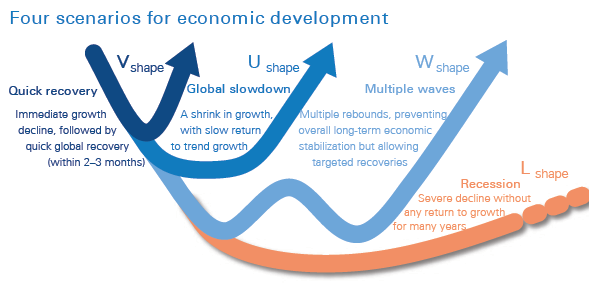
V–shaped
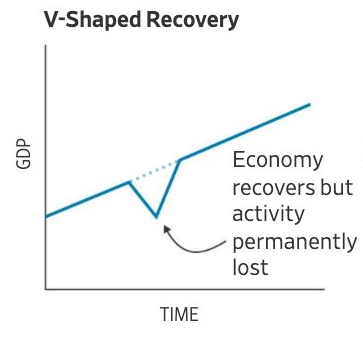
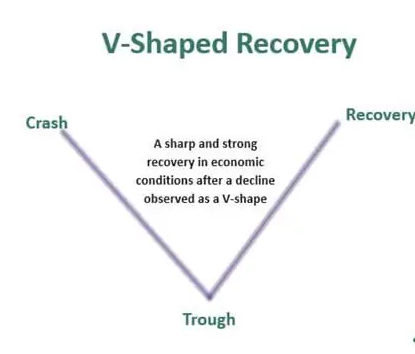
A V-shaped recovery is a quick, sharp improvement in an economy after a sharp decline. On a graph of gross domestic product (GDP) over time, the decline forms the left side of the letter V. The recession is the point at the bottom, then rapid improvement from that point forms the right side of the letter V.
A V-shaped recovery usually characterizes a recovery after a recession caused by a one-time shock. As a consumer, business-owner, investor, or other participant in the economy, it helps to understand how a V-shaped recovery works.
Example – Covid-19 Pandemic of 2020
The Covid-19 Pandemic of 2020 caused several indicators in nearly all countries to plummet as the world was forced to shut its doors. This led to severe declines in things like industrial production, employment, and GDP.
One can identify a V-shaped recovery by the sharp correction in these economic factors, signaling that the economy is recovering rapidly. The correction will be sharp. As the economy finds a floor or bottom, indicators will bounce and correct to levels achieved before the event occurred.
The Recession of 1953
The recession of 1953 in the United States is another clear example of a V-shaped recovery. This recession was relatively brief, and mild with only a 2.2% decline in GDP and unemployment rate of 6.1%. Growth began to slow in the third quarter of 1953, but by the fourth quarter of 1954 was back at a pace well above the trend. Therefore, the chart for this recession and recovery would represent a V-shape.
For an economy to achieve a V-shaped recovery, it often takes aggressive actions from the government and, in many instances, the private sector. Therefore, a V-shaped recovery is a best-case scenario for an economy to recuperate the losses and continue to grow and expand.
L–shaped recovery
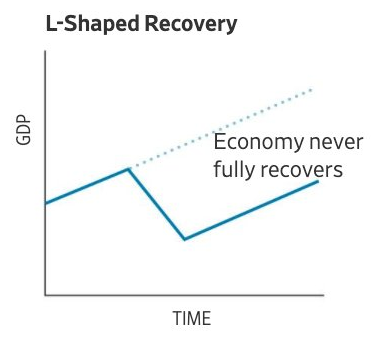
An L–shaped recovery is a type of recovery characterized by a slow rate of recovery, with persistent unemployment and stagnant economic growth. L-shaped recoveries occur following an economic recession characterized by a more-or-less steep decline in the economy, but without a correspondingly steep recovery.
Example – Lost decade in Japan
What is known as the lost decade in Japan is widely considered to be an example of an L-shaped recovery. Leading up to the 1990s, Japan was experiencing remarkable economic growth. In the 1980s, the country ranked first for gross national production per capita. During this time, real estate and stock market prices were quickly rising. Concerned about an asset price bubble, the Bank of Japan raised interest rates in 1989. A stock market crash followed, and annual economic growth slowed from 3.89 percent to an average of 1.14 percent between 1991 to 2003.
U–shaped recovery
A U–shaped recovery describes a type of economic recession and recovery that charts a U shape, established when certain metrics, such as employment, GDP, and industrial output sharply decline and then remain depressed typically over a period of 12 to 24 months before they bounce back again.
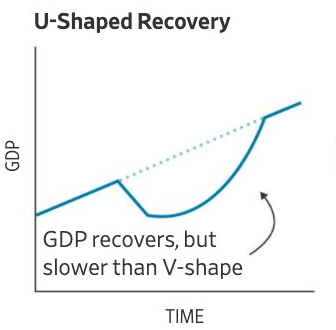
Examples of U-shaped recoveries are the 1973-75 Nixon recession and the 1990-91 recession following the S&L crisis in US.
W-shaped Recovery
A W-shaped recovery is when an economy passes through a recession into recovery and then immediately turns down into another recession. A W-shaped recovery involves a sharp decline in these metrics followed by a sharp rise back upward, followed again by a sharp decline and ending with another sharp rise. The middle section of the W can represent a significant bear market rally or a recovery that was stifled by an additional economic crisis.
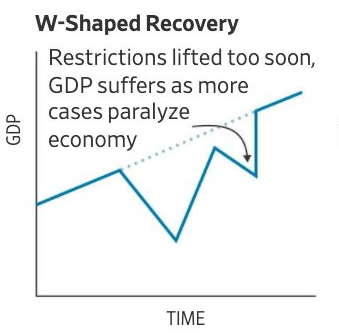
Example – US economy in 1980’s
The United States experienced a W-shaped recovery in the early 1980s. From January to July 1980 the U.S. economy experienced the initial recession, and then entered recovery for almost a full year before dropping into a second recession in 1981 to 1982.
K-shaped recovery
A K-shaped recovery is a post-recession scenario in which one segment of the economy begins to climb back upward while another segment continues to suffer. If illustrated, the economic growth would roughly resemble the two diverging diagonal lines of the letter "K" - hence the name.
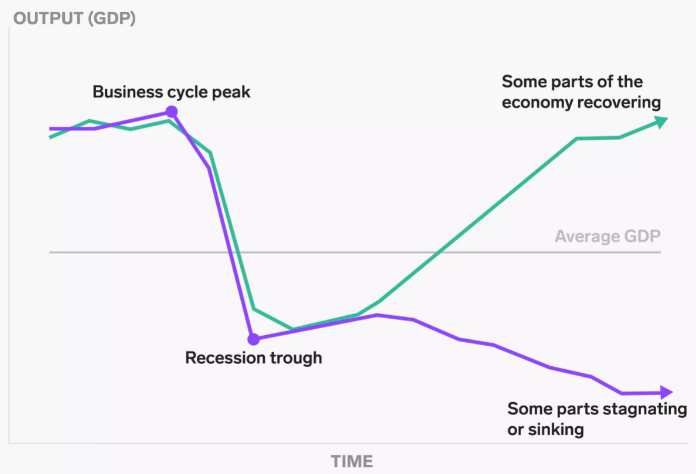
While V-shaped, U-shaped, and W-shaped recoveries have been around for decades, the concept of a K-shaped recovery first emerged in 2020 during the COVID-19 pandemic.
In a K-shaped economy,
Households at the top of the pyramid are likely to have seen their incomes largely protected, and savings rates forced up during the lockdown, increasing ‘fuel in the tank’ to drive future consumption.
Meanwhile, households at the bottom are likely to have witnessed permanent hits to jobs and incomes,
What's particularly concerning about a K-shaped recovery is the way it splinters the economy, continually widening the gap between those who are doing well and those who are not.
In the end, a K-shaped recovery makes any existing problems of economic inequality much worse.
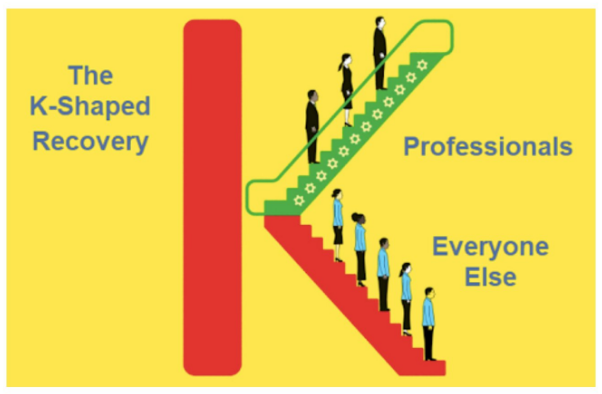
In a nutshell,
© 2024 iasgyan. All right reserved